140
saia-pcd.com
SBC
Consumption data collection
The S-Monitoring COSinus function comprises the following three parts:
1. Autoscan of S-Bus energy meters and pulse counters
If the S-Bus Autoscan is activated, meters connected to the RS-485 interface are automatically detected and read.
By permanently requesting the meter data, remote diagnosis of the S-Bus meters and bus connection is possible.
S-Monitoring COSinus function
S-Monitoring is an integral part of the COSinus operating system and is integrated into all Saia PCD® controllers ending with xx60
and having the pWeb Panel MB. It is activated in the PG5 Device Configurator and it scans connected meters automatically. The data
is saved on the file system. In addition to connected S-Bus meters, any meter values available in the program can also be integrated.
The S-Monitoring function can read three different types of meters:
f
f
Connected S-Bus energy meters and S0pulse counters (PCD7.H104SE)
f
f
Other incremental meter values (M-Bus, Modbus, etc. are referred to as "custom meters" and captured via FBoxes
in the Fupla program)
f
f
Groups of meters
Excel Report Tool
When the COSinus function is activated,
the data can simply be imported into Excel
without programming.
Download:
4.6
Basic functions of the S-Monitoring application
Function for automatic capturing and saving of energy meter values –
integrated into the operating system of the Saia PCD®
The S-Monitoring application works on all controllers ending in xx60 and on the pWeb Panels. The applica-
tion consists of a COSinus function and an associatedWeb Editor project. This makes it possible to capture,
save and visualise data without significant programming effort. With S-Bus meters, this works without any
program in the controller.
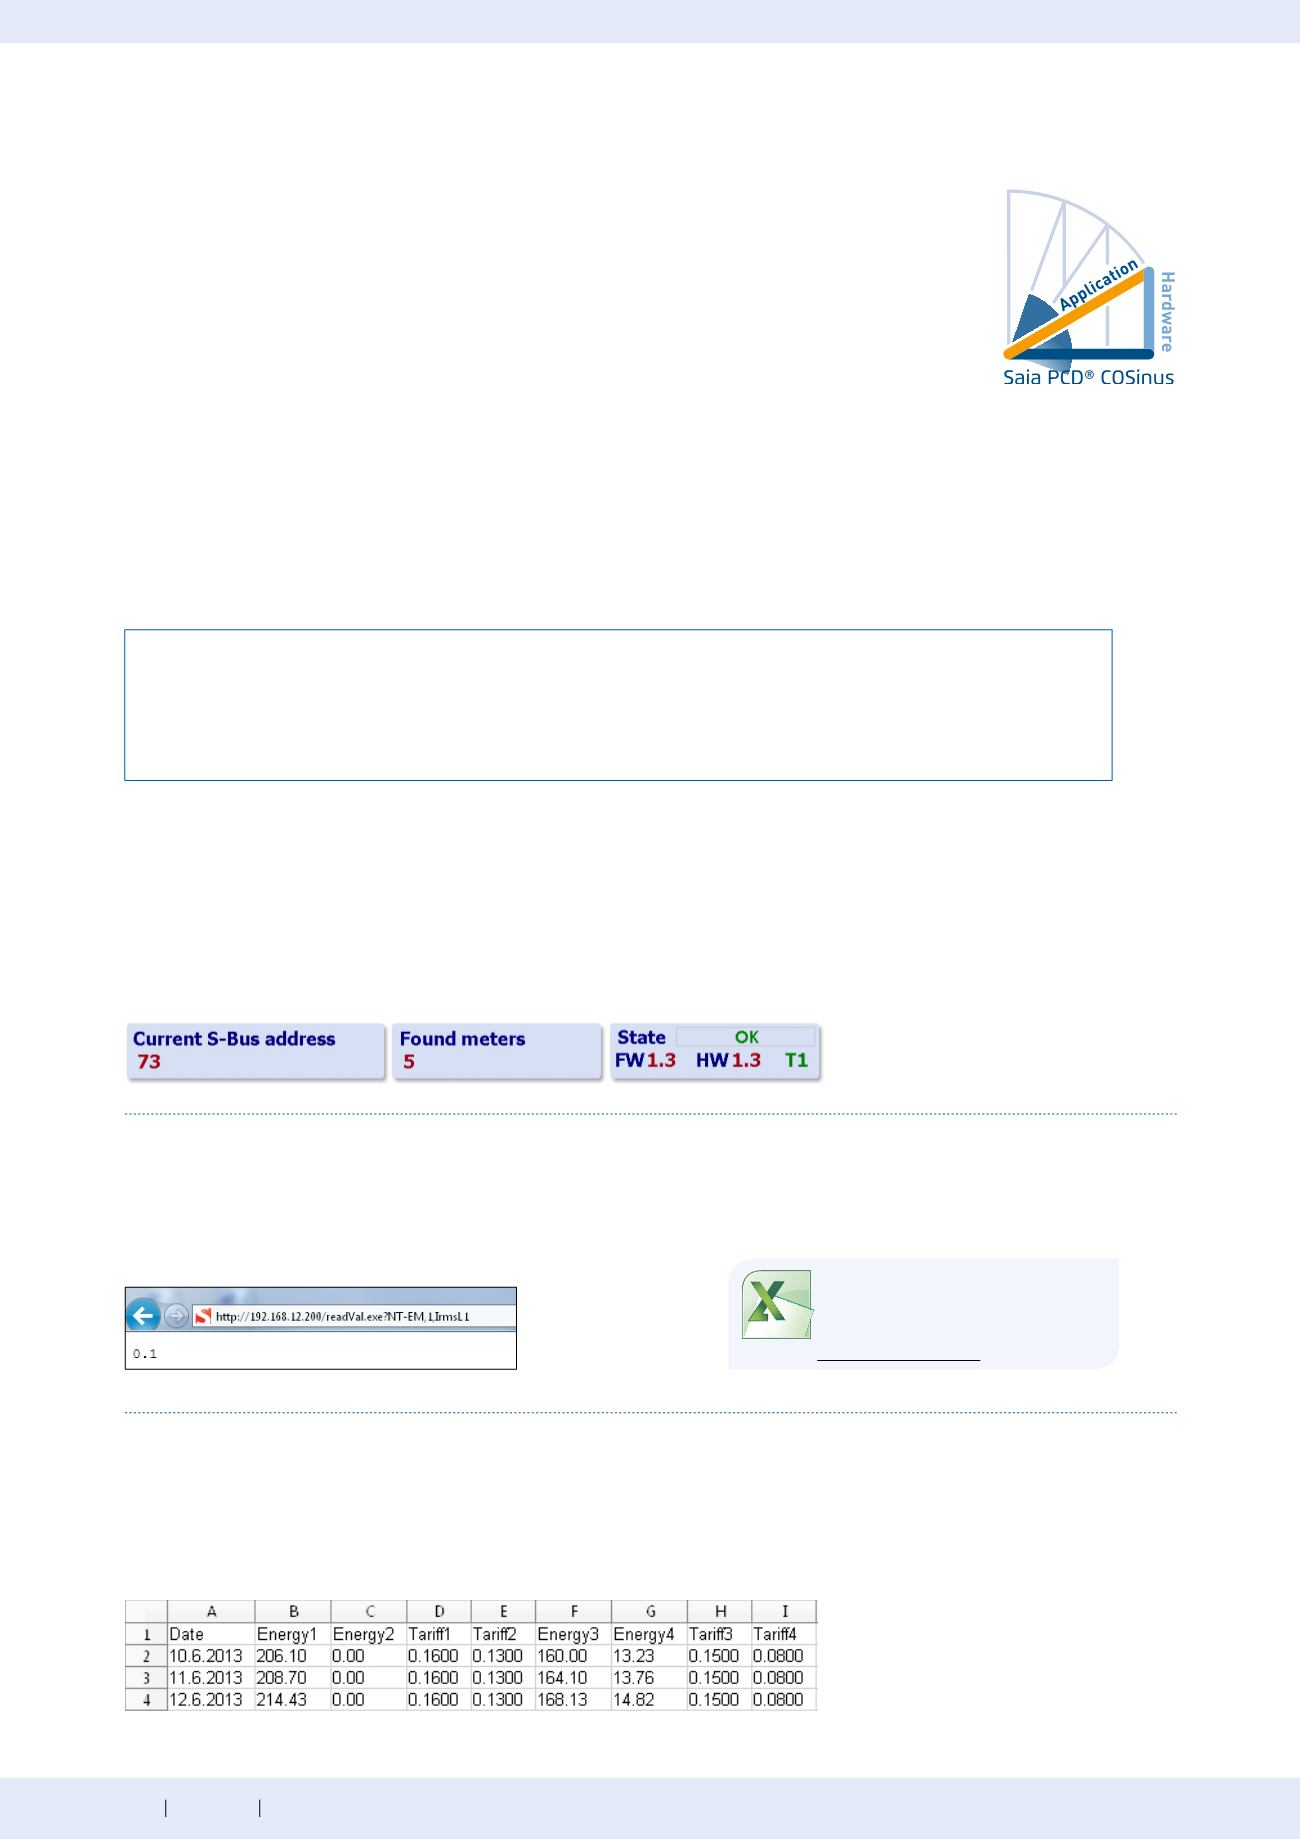
3. Saving the meter values in CSV files
The values of the energy meters connected are saved once a day at midnight in a CSV file on the internal file system of the PCD.
The daily, weekly and monthly consumption can be calculated from this data. If an additional memory card is inserted, the values
can be saved at 5-60 minute intervals. This makes it possible to visualise consumption over a day.
2. Provision of meter values via NT-EM tags (CGI interface)
All data and basic functions can be called up via CGI tags. These functions can therefore be accessed via the web interface
or by other programs (e.g. Excel). The controller does not need a Fupla or IL program (see document 27/623).
NT-EM tag (CGI command) in the web browser:
Command
Value


