127
saia-pcd.com
S-Monitoring
1
5
2
3
4
Dedicated
room controller
HMI Visualization
and operating
Automation
stations
Cabinet
components
Consumption data
acquisition
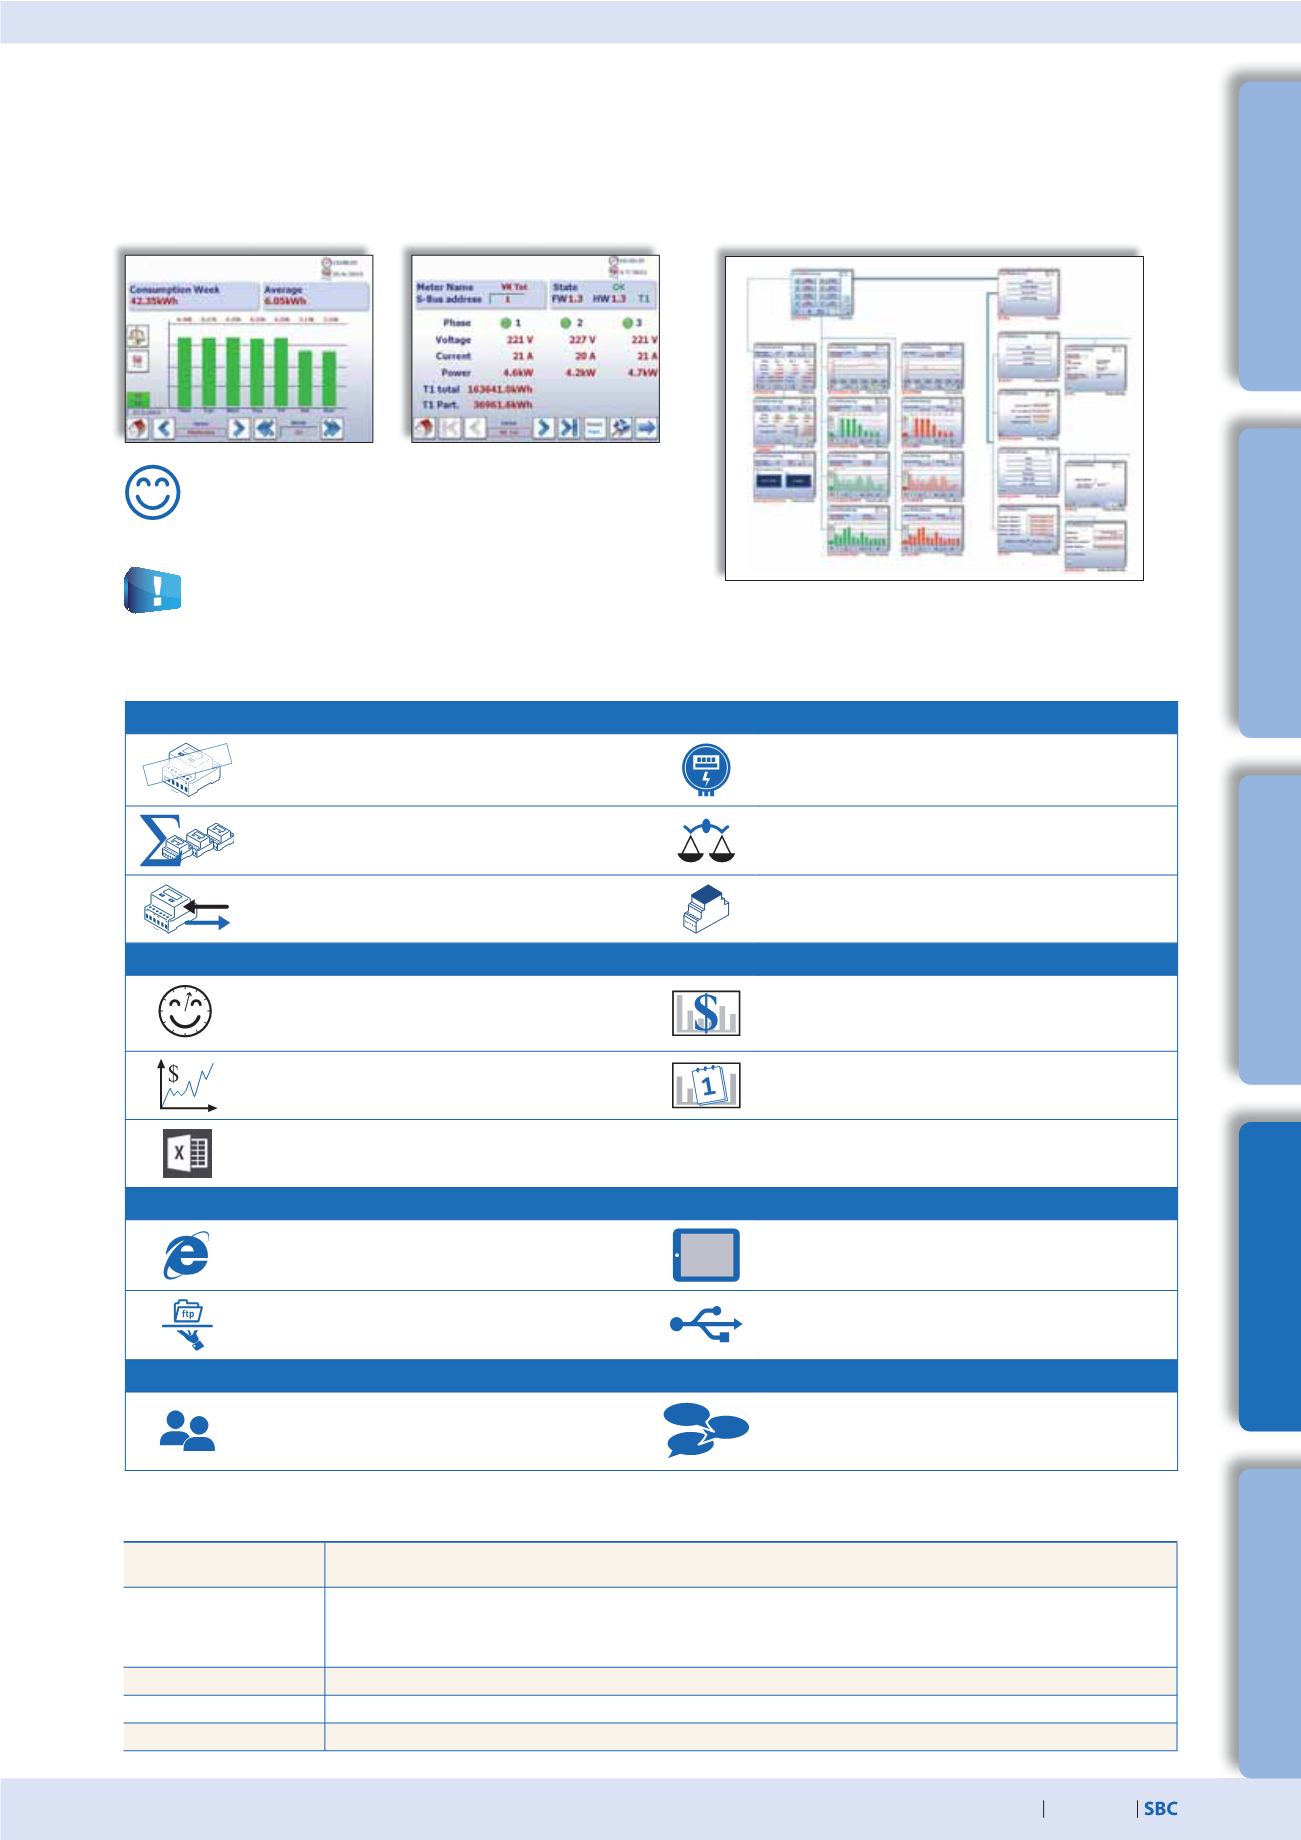
SBC delivers a PG5 project which also includes a web visualisation. The project is based on the COSinus functions and
enables saved data to be visualised on the PC immediately. As only the S-Monitoring COSinus function is accessed in the web project,
it does not need a PG5 program. It can therefore be easily integrated in existing projects. In addition, the most important websites
are available as macros in Web Editor 8.
S-Monitoring web project
Capturing of energy values
plug & count
Automatic detection of
connected energy meters
Display
of the energy meter status
Grouping
of the energy meters
Comparison
between meters and periods
Connection
of bidirectional meters
Connection of H104SE coupler modules
(for S0 meters)
Presentation and evaluation of energy values
Current meter readings such as consumption,
voltage, current, active and reactive output and
cosφ
Evaluation and presentation
of the costs
Visualisation in
bar charts and trend diagrams
Consumption and costs presentation
per day/week/month/year
1)
Data storage
in Excel-readable CSV files
Remote access via network and Internet
Operation at the PC with standard browser
(IE, Chrome, Firefox)
Operation
via smartphone and tablet
Access to log data and web project
with FTP
Integrated USB port
for update and maintenance
User support
User administration
with up to 2 user levels
?
!
. . .
User interface
in several languages
Technical data for SBC S-Monitoring
SBC S-Monitoring COSinus
function integrated in
PCD1.M0160E0 (E-Controller)
PCD3.Mxx60
PCD7.D457VT5E (E-Monitor)
PCD1.M2160
PCD7.DxxxxT5F (pWeb Panel MB)
Supported meters
– Saia PCD® S-Bus energy meters, PCD7.H104SE pulse counters
– Incremental meter values
(M-Bus, Modbus, etc. are referred to as“custom counters”and captured via FBoxes in the Fupla program)
– Meter groups
Maximum number of meters
128 Saia PCD® S-Bus meters* / 256 custom counters* / 32 groups*
*in total max. 256
Data storage time
Max. 4 years
Saved data
Max. 4 meter values with 4 tariffs per meter are saved once a day (at midnight)
1)
Daily view only available if memory extension is plugged in
In the PG5 application for the E-Controller and E-
Monitor products provided ready for use upon delivery
from the factory, additional “Advanced” functions are
programmed in PG5. These cannot therefore be used
without the program.
S-Monitoring is also supported by pWeb Panel
PCD7.DxxxxT5F, PCD1.M2160 and PCD3xx60
S
Complete overview of the basic application
Basic functions of the S-Monitoring application


