127
saia-pcd.com
Consumption data collection
5
Switch cabinet
components
4
Consumer
data acquisition
3
Dedicated
room controllers
2
Operation
and monitoring
1
Automation
stations
Remote visualisation and evaluation of consumption
Reading and operating via LAN/Internet with web browser and mobile devices
Integration into other systems via standard interfaces
If the Web Panel and controller are connected to a network (LAN), meter readings and operation can be carried out using
commercially available PCs with standard browsers. Special software installations are not required and apps are available
for mobile devices. This can even be carried out across locations if there is an Internet connection.
Databases, energy management software or control systems can be connected via standard interfaces (e.g. FTP, CGI, HTTP,
etc.).
With step-by-step introduction, findings from the learning
curve are incorporated and lead to optimum results
Record consumption
Wide range of single and 3-phase energy meters up to 6,000 A
S0 interface for the integration of commercially available meters for gas, water, oil, etc.
Saia PCD® energy meters follow established installation technology and are suitable for DIN rails of commercially available
distribution boxes. They measure electrical work (kWh) as well as electrical quantities such as current, voltage, active and
reactive power and the power factor cosφ. Integrated into a bus system covering a distance of up to 1 km, the values are
transmitted to the Web Panel and controllers for the purpose of analysis and logging.
Via pulse counters with an interface, commercial available meters with S0 output or PT 1000 temperature sensors can be
connected to the bus system.
Logging consumption
Historical consumption readings (Day /Week /Month /Year)
Logging in Excel-readable files
The Web Panel and controllers read consumption values of the connected meters and display them in the form of a web
visualisation. This can be called up either directly on the Web Panel or via the controller’s web server with a web browser.
Consumption and costs can be called up in meaningful diagrams via an intuitive user interface. In addition, the Web Panel and
controllers record captured values in Excel-readable CSV files, which can be easily transferred to a PC via FTP. The function can
be activated on any new controller. The e-Controller and e-Monitor are already pre-installed in the factory and are ready for
use without further programming.
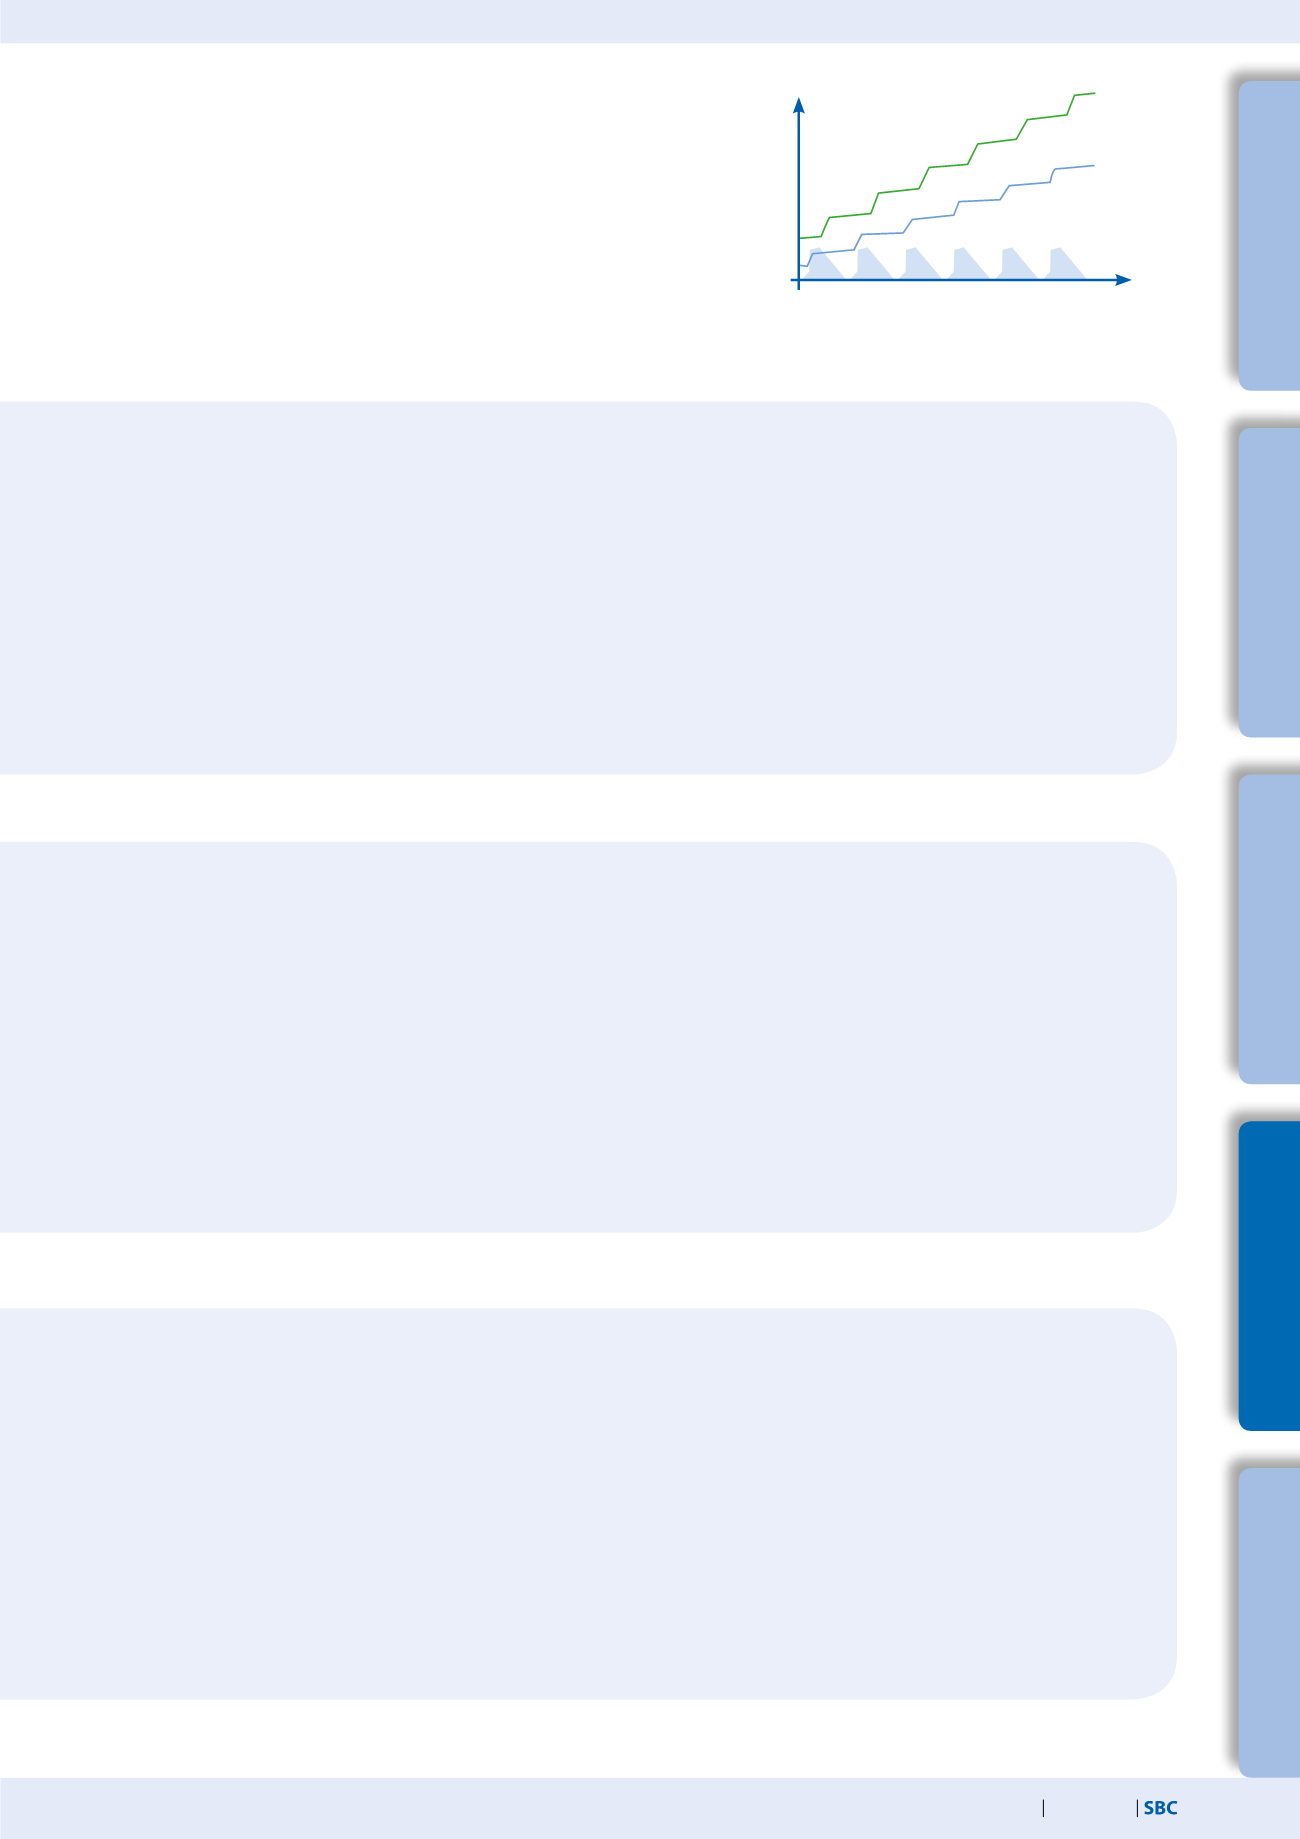
Continuous optimisation in calculable steps:
Sustainable resource management means a continuous gain in knowledge in
a changing environment. The optimum solution is different for each business,
and must be developed with careful consideration. S-Monitoring supports a
cautious approach in small, controllable steps and starts with the basics. It is
possible to start resource management without external help using cost-effec-
tive, easy-to-install components. Even after just a few days, initial results are
set and point the way for further optimisation steps. The investment risk is
negligible and remains limited to each individual development step.
Effect
Cost
Risk
Time


