182
saia-pcd.com
SBC Software
Visualization and graphical editor
All relevant parts of the system can be presented to the user in the most
appropriate way with the powerful graphical editor. The use of vector and
bitmap graphics allows both overviews and detailed information to be
displayed. The graphical editor also helps with visualization in runtime mode.
This means that the user can switch to editor mode at any time (via password)
to make corrections and changes.
Operator programs
Web Server
All graphics pages generated are automatically saved as web pages. All
generated pages and functions can be displayed and operated using a
browser, by activating the Visi.Plus web server.
Log
This module logs and stores all events in a file at user level. The log viewer, with its
integral filter functions, allows all important events to be displayed in the most
appropriate way to the user.
Alarmmanagement
Alarm management is an essential constituent of any building management system.
With SaiaVisi.Plus it is possible, by observing limit values, to display all relevant data
points for the user in a plain-text alarm window. Two separate alarm lists provide a
better overview. The first gives an overview of all alarms; the second enables all
current alarms to be examined.
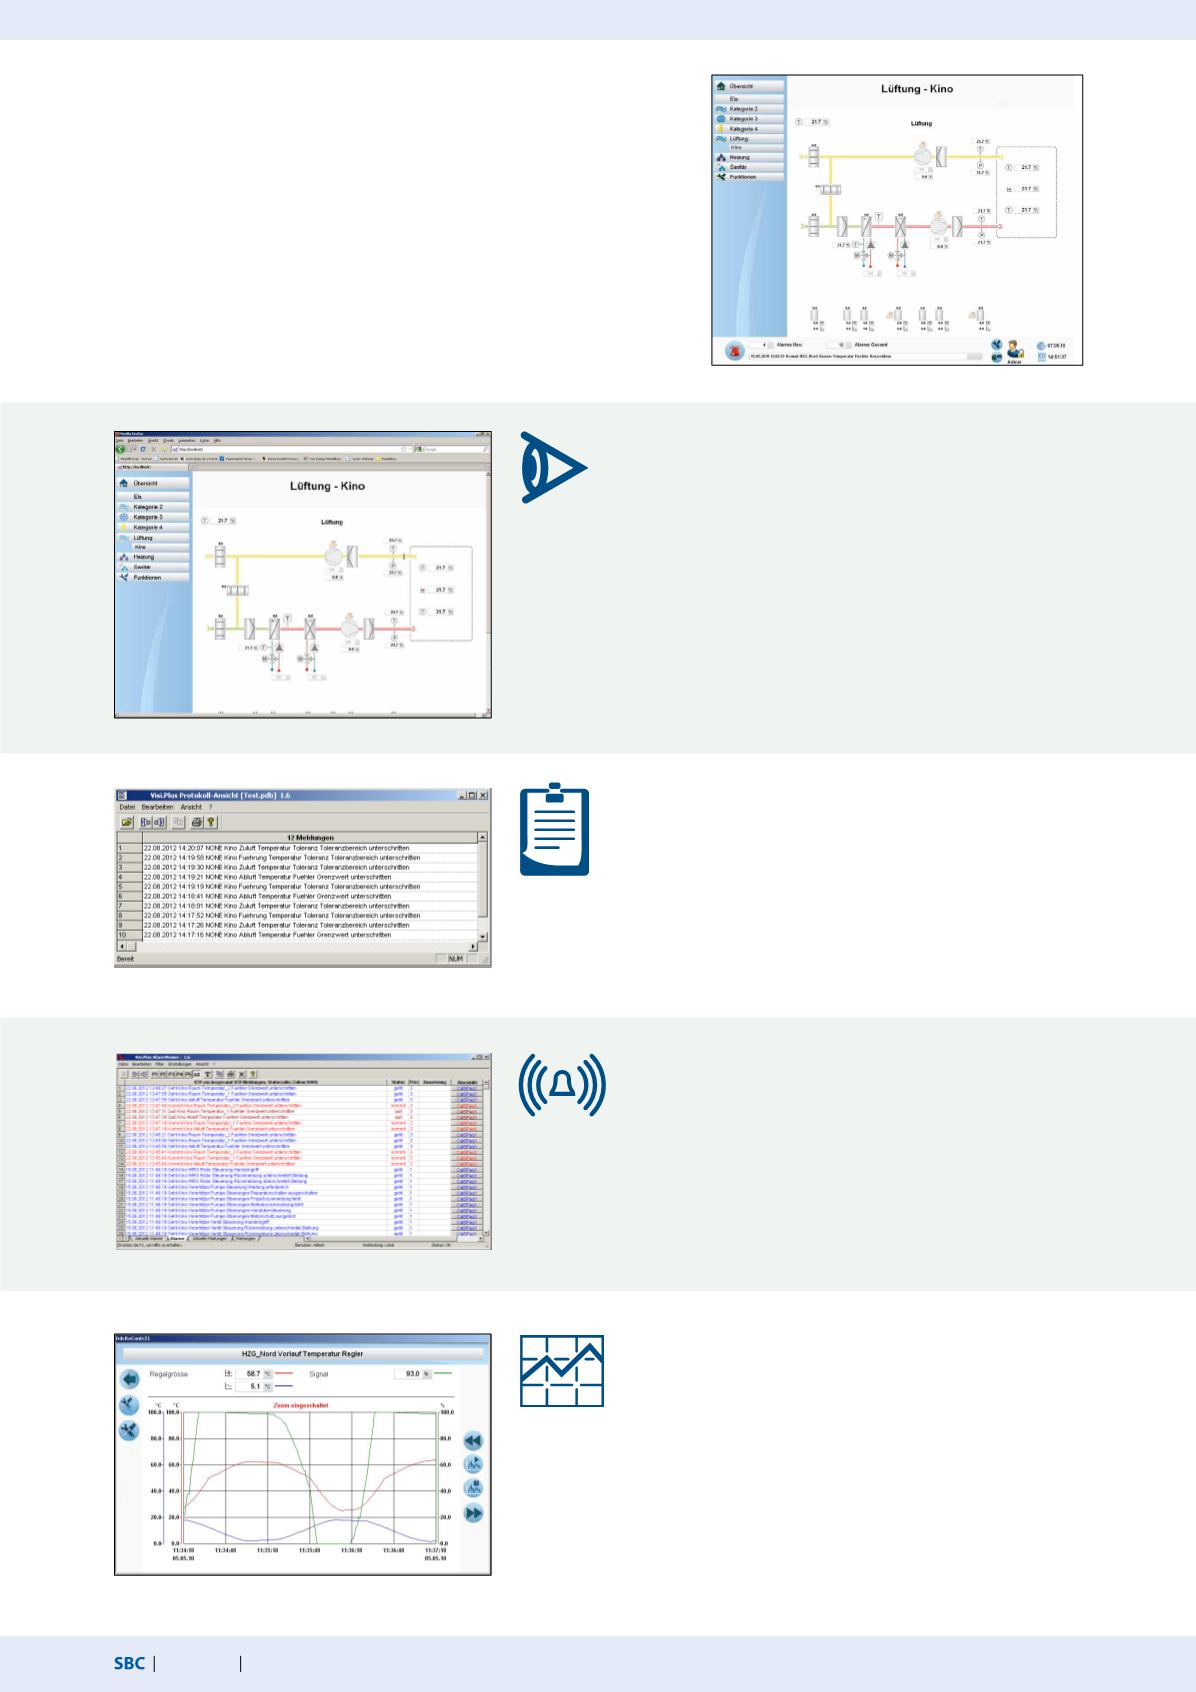
Trend display
With this module you can, for example, receive a monthly summary energy
balance sheet for all consumers in a building. Whether you have to monitor the
consumption of water, electricity or heat, this trend analysis provides you with
the necessary overview to enable suitable measures to be initiated.


