146
saia-pcd.com
SBC
Consumption data collection
Technical data for SBC S-Monitoring
SBC S-Monitoring COSinus
function integrated in
PCD1.M0160E0 (E-Controller)
PCD3.Mxx60
PCD7.D457VT5E (E-Monitor)
PCD1.M2160
PCD7.DxxxxT5F (pWeb Panel MB)
Supported meters
– Saia PCD®S-Bus energy meters, PCD7.H104SE S0 pulse counters
– Incremental meter values (M-Bus, Modbus, etc. are referred to as "custom meters" and captured via FBoxes in the Fupla program)
– Meter groups
Maximum number of meters
128 Saia PCD® S-Bus meters* / 256 custom meters* / 32 groups*
*in total max. 256
Data storage time
4 years maximum; a recording per day
saved data
max. 4 meter values with 4 tariffs per meter are saved once a day (at midnight)
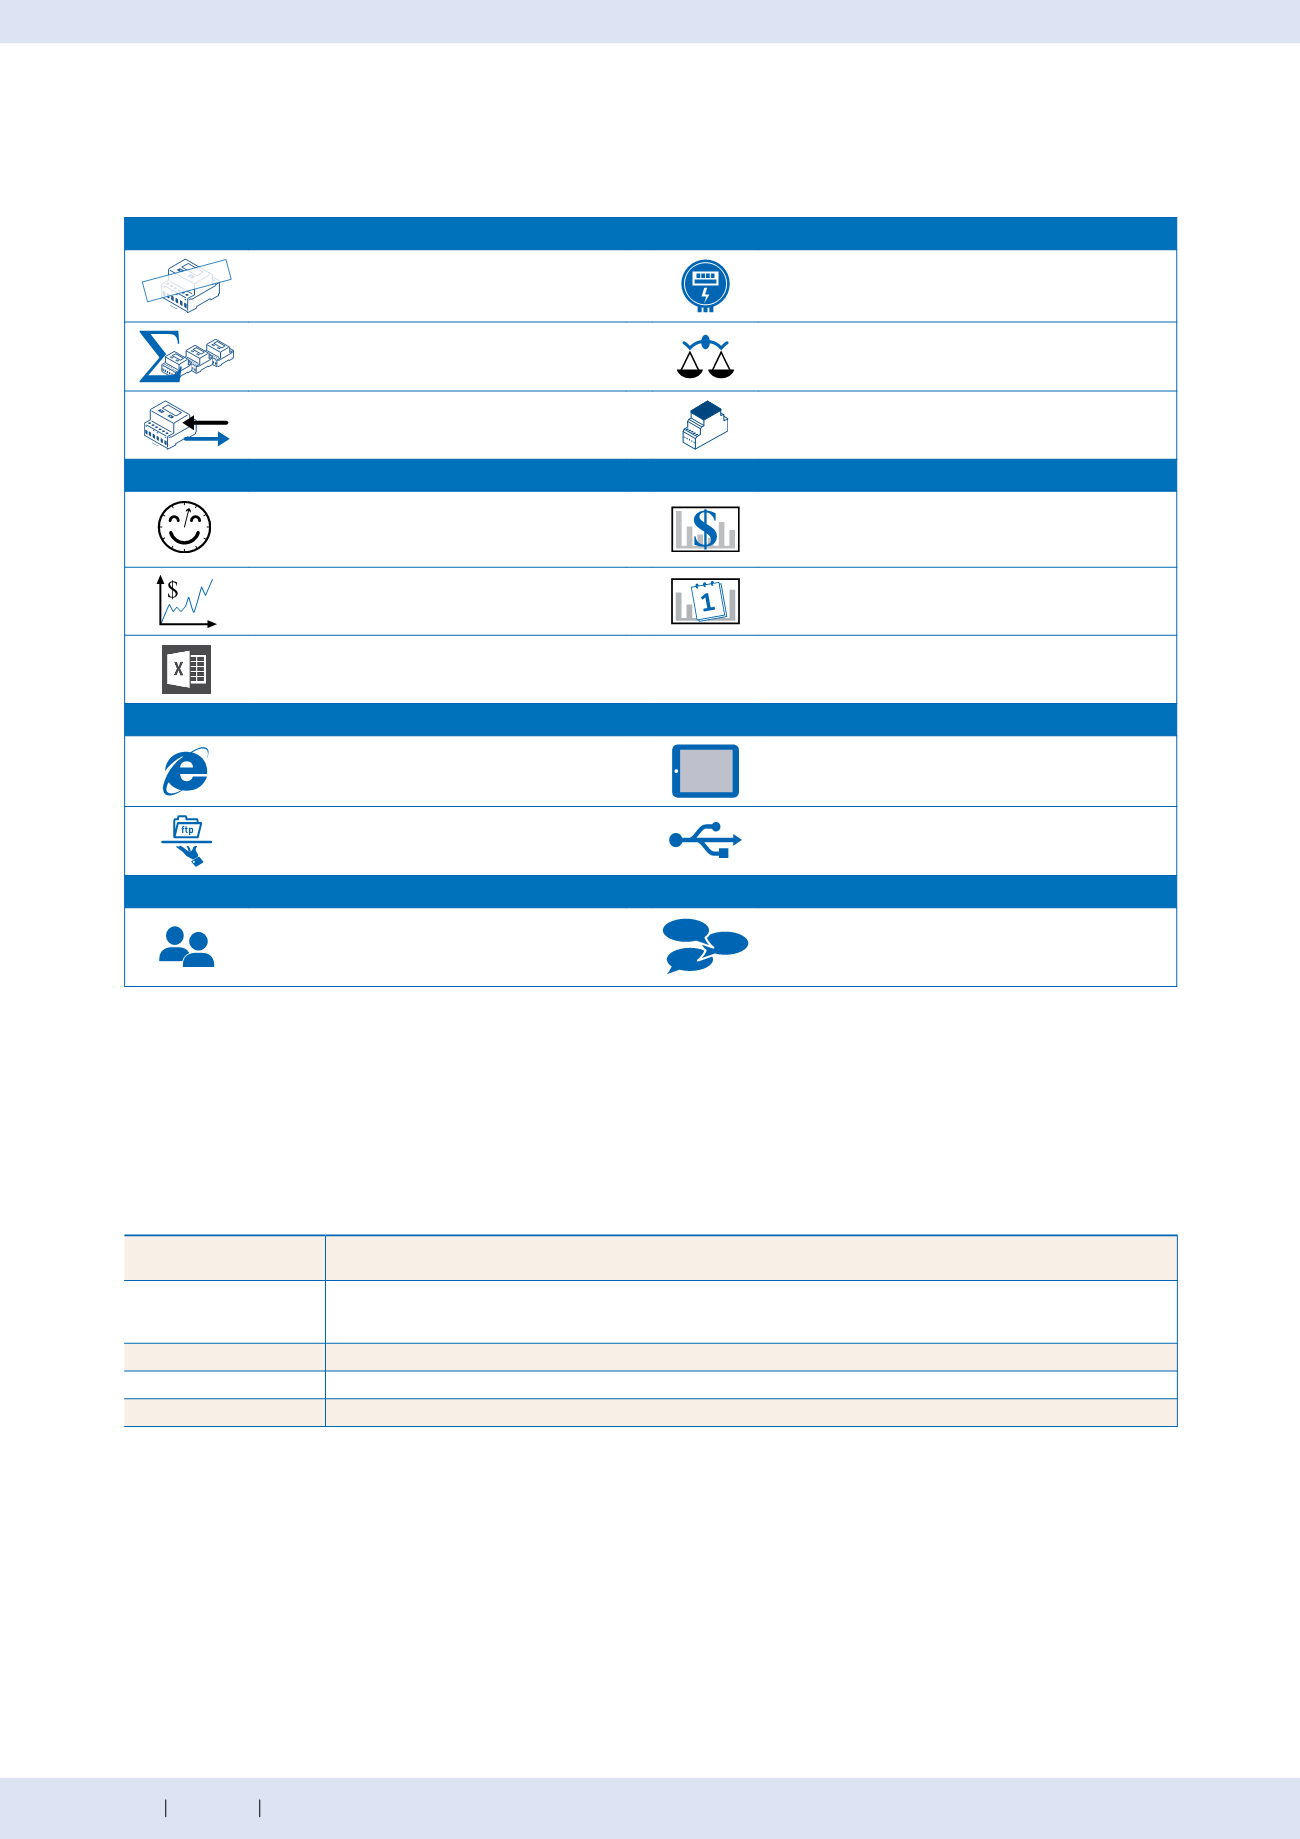
Recording of energy values
Plug & count
Automatic detection of connected energy
meters
Display of the energy meter status
Grouping of energy meters
Comparison between meter and periods
Connection of bidirectional meters
Connection PCD7.H104SE S0 impulse counter
(for S0 meters)
Display and analysis of energy values
Current meter values such as consumption,
voltage, current, active and reactive power and
cosφ
Evaluation and presentation of the costs
Visualisation in bar charts and trend charts
Consumption and costs presentation
per day/week/month/year1)
Data storage in Excel-readable CSV files
Remote access via network and Internet
Operation at the PC with standard browser
(IE, Chrome, Firefox)
Operation via smartphone and tablet
Access to log data and web project with FTP
Integrated USB port for update and maintenance
User support
User administration
?
!
. . .
Control interface in several languages
1)
Daily view only available if memory extension is plugged in
Basic functions of the S-Monitoring application


